

by Enoch Mwathwa
Ethereum price extended its decline on January 30, hitting its lowest level since November 17 and marking its second straight week of losses. ETF outflows, macro uncertainty, and a major on-chain transfer by Vitalik Buterin pressured the market. Traders now question whether ETH could fall toward the $2,000 level as technical indicators turn increasingly bearish.
Macro Factors and Vitalik Transfer Drive Market Pressure
Ethereum price followed the broader crypto market downturn as macro uncertainty increased. The latest catalyst came after Donald Trump nominated Kevin Warsh as the next Federal Reserve Chair. Markets had priced in Rick Rieder as a more market-friendly candidate, which led to sudden repricing across risk assets when the decision changed.
Crypto prices also declined as investors shifted capital into hard assets such as gold and silver amid rising geopolitical tensions in Iran. At the same time, ETF outflows continued, signaling reduced institutional demand for Ethereum and other cryptocurrencies.
Vitalik Buterin added to market anxiety after moving 16,834 ETH worth about $44 million, according to Arkham data. He still holds around 240,000 ETH valued at more than $657 million. Large founder transfers often trigger sell-off fears, but Buterin stated the funds will support Ethereum development.
In these five years, the Ethereum Foundation is entering a period of mild austerity, in order to be able to simultaneously meet two goals:
1. Deliver on an aggressive roadmap that ensures Ethereum's status as a performant and scalable world computer that does not compromise on…
— vitalik.eth (@VitalikButerin) January 30, 2026
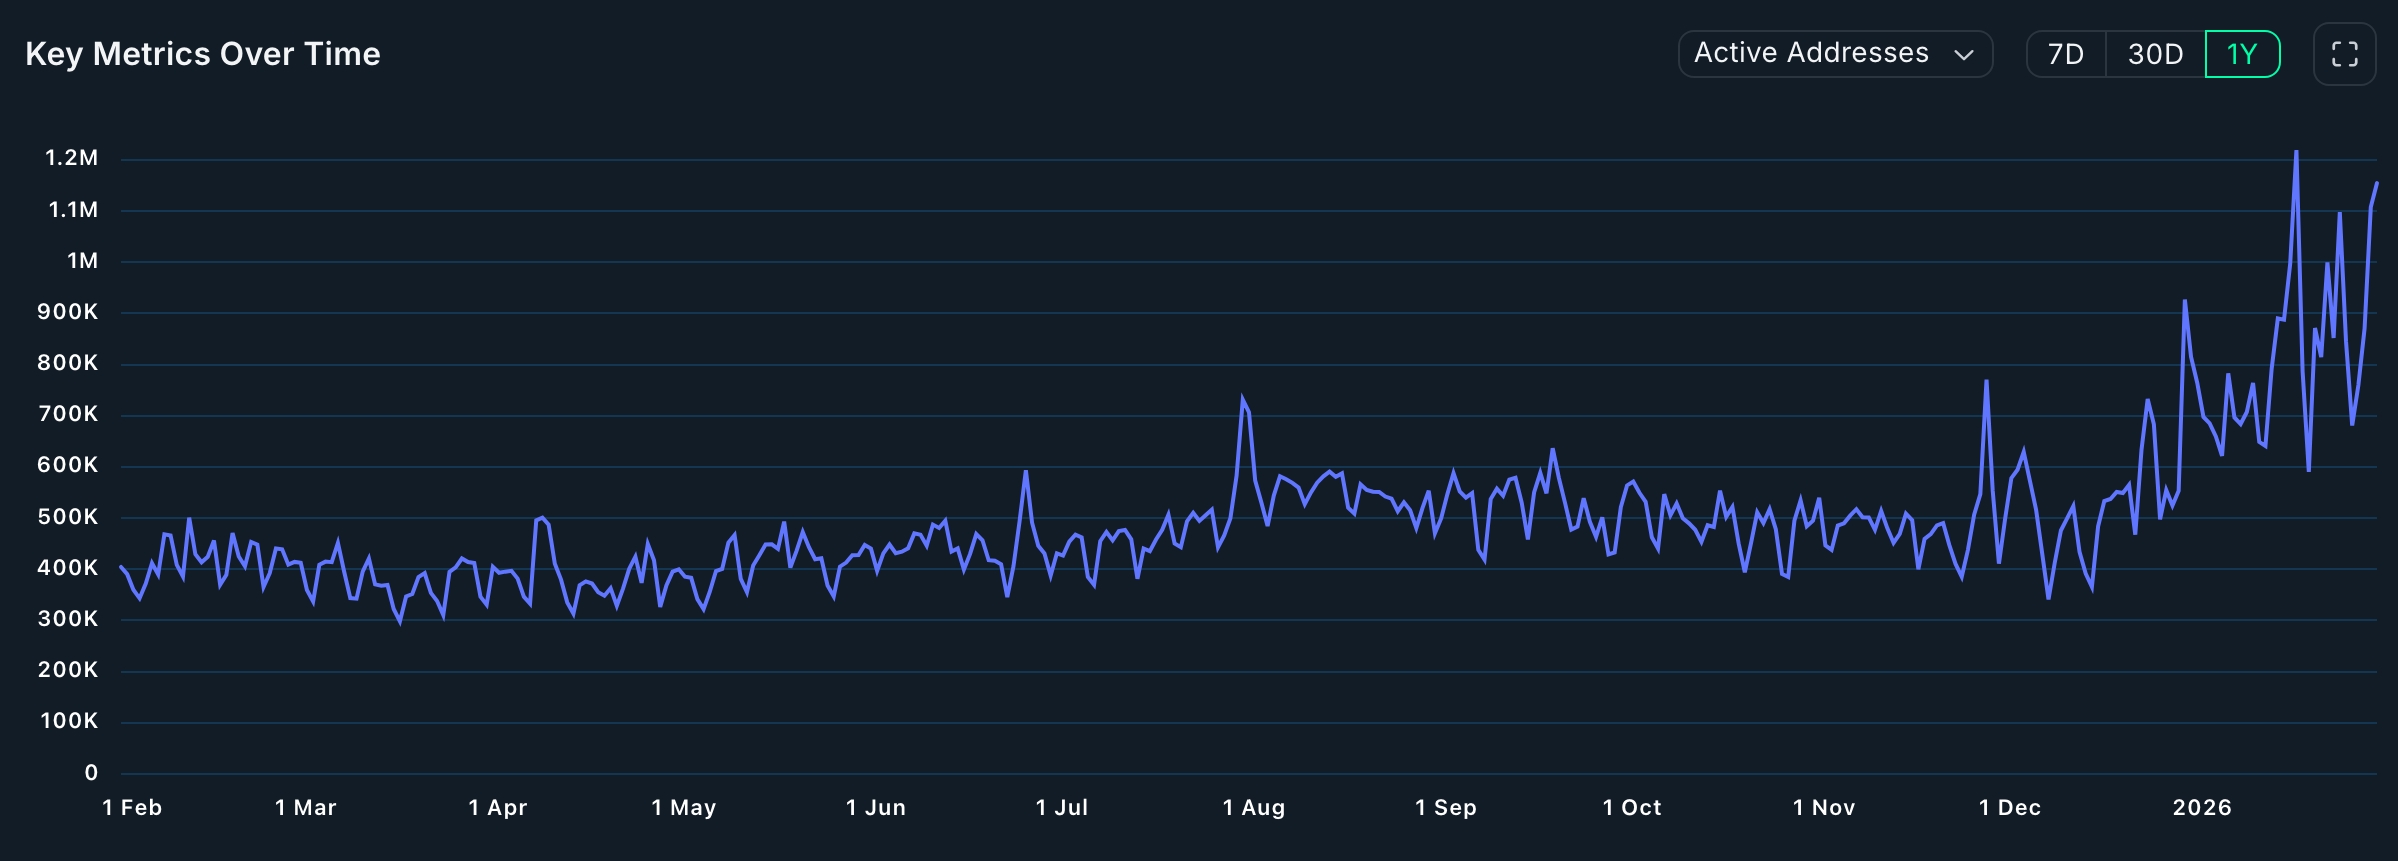
He plans to finance an aggressive roadmap focused on scalability, performance, and decentralization. He also aims to expand decentralized staking to strengthen Ethereum Foundation funding. Despite price weakness, Ethereum network activity remains strong. Active users rose by 47% in the last 30 days, while active addresses surpassed 64 million. Developers expect further growth after the upcoming Glamsterdam upgrade, which promises improved privacy and performance.
Technical Analysis Points to Possible Drop Toward $2,000
Technical indicators suggest Ethereum may face more downside. ETH dropped from a peak of $4,950 in August to around $2,730 and formed a bearish flag pattern on the weekly chart. The price remains below the 50-week Exponential Moving Average and the Supertrend indicator, confirming a strong downtrend.
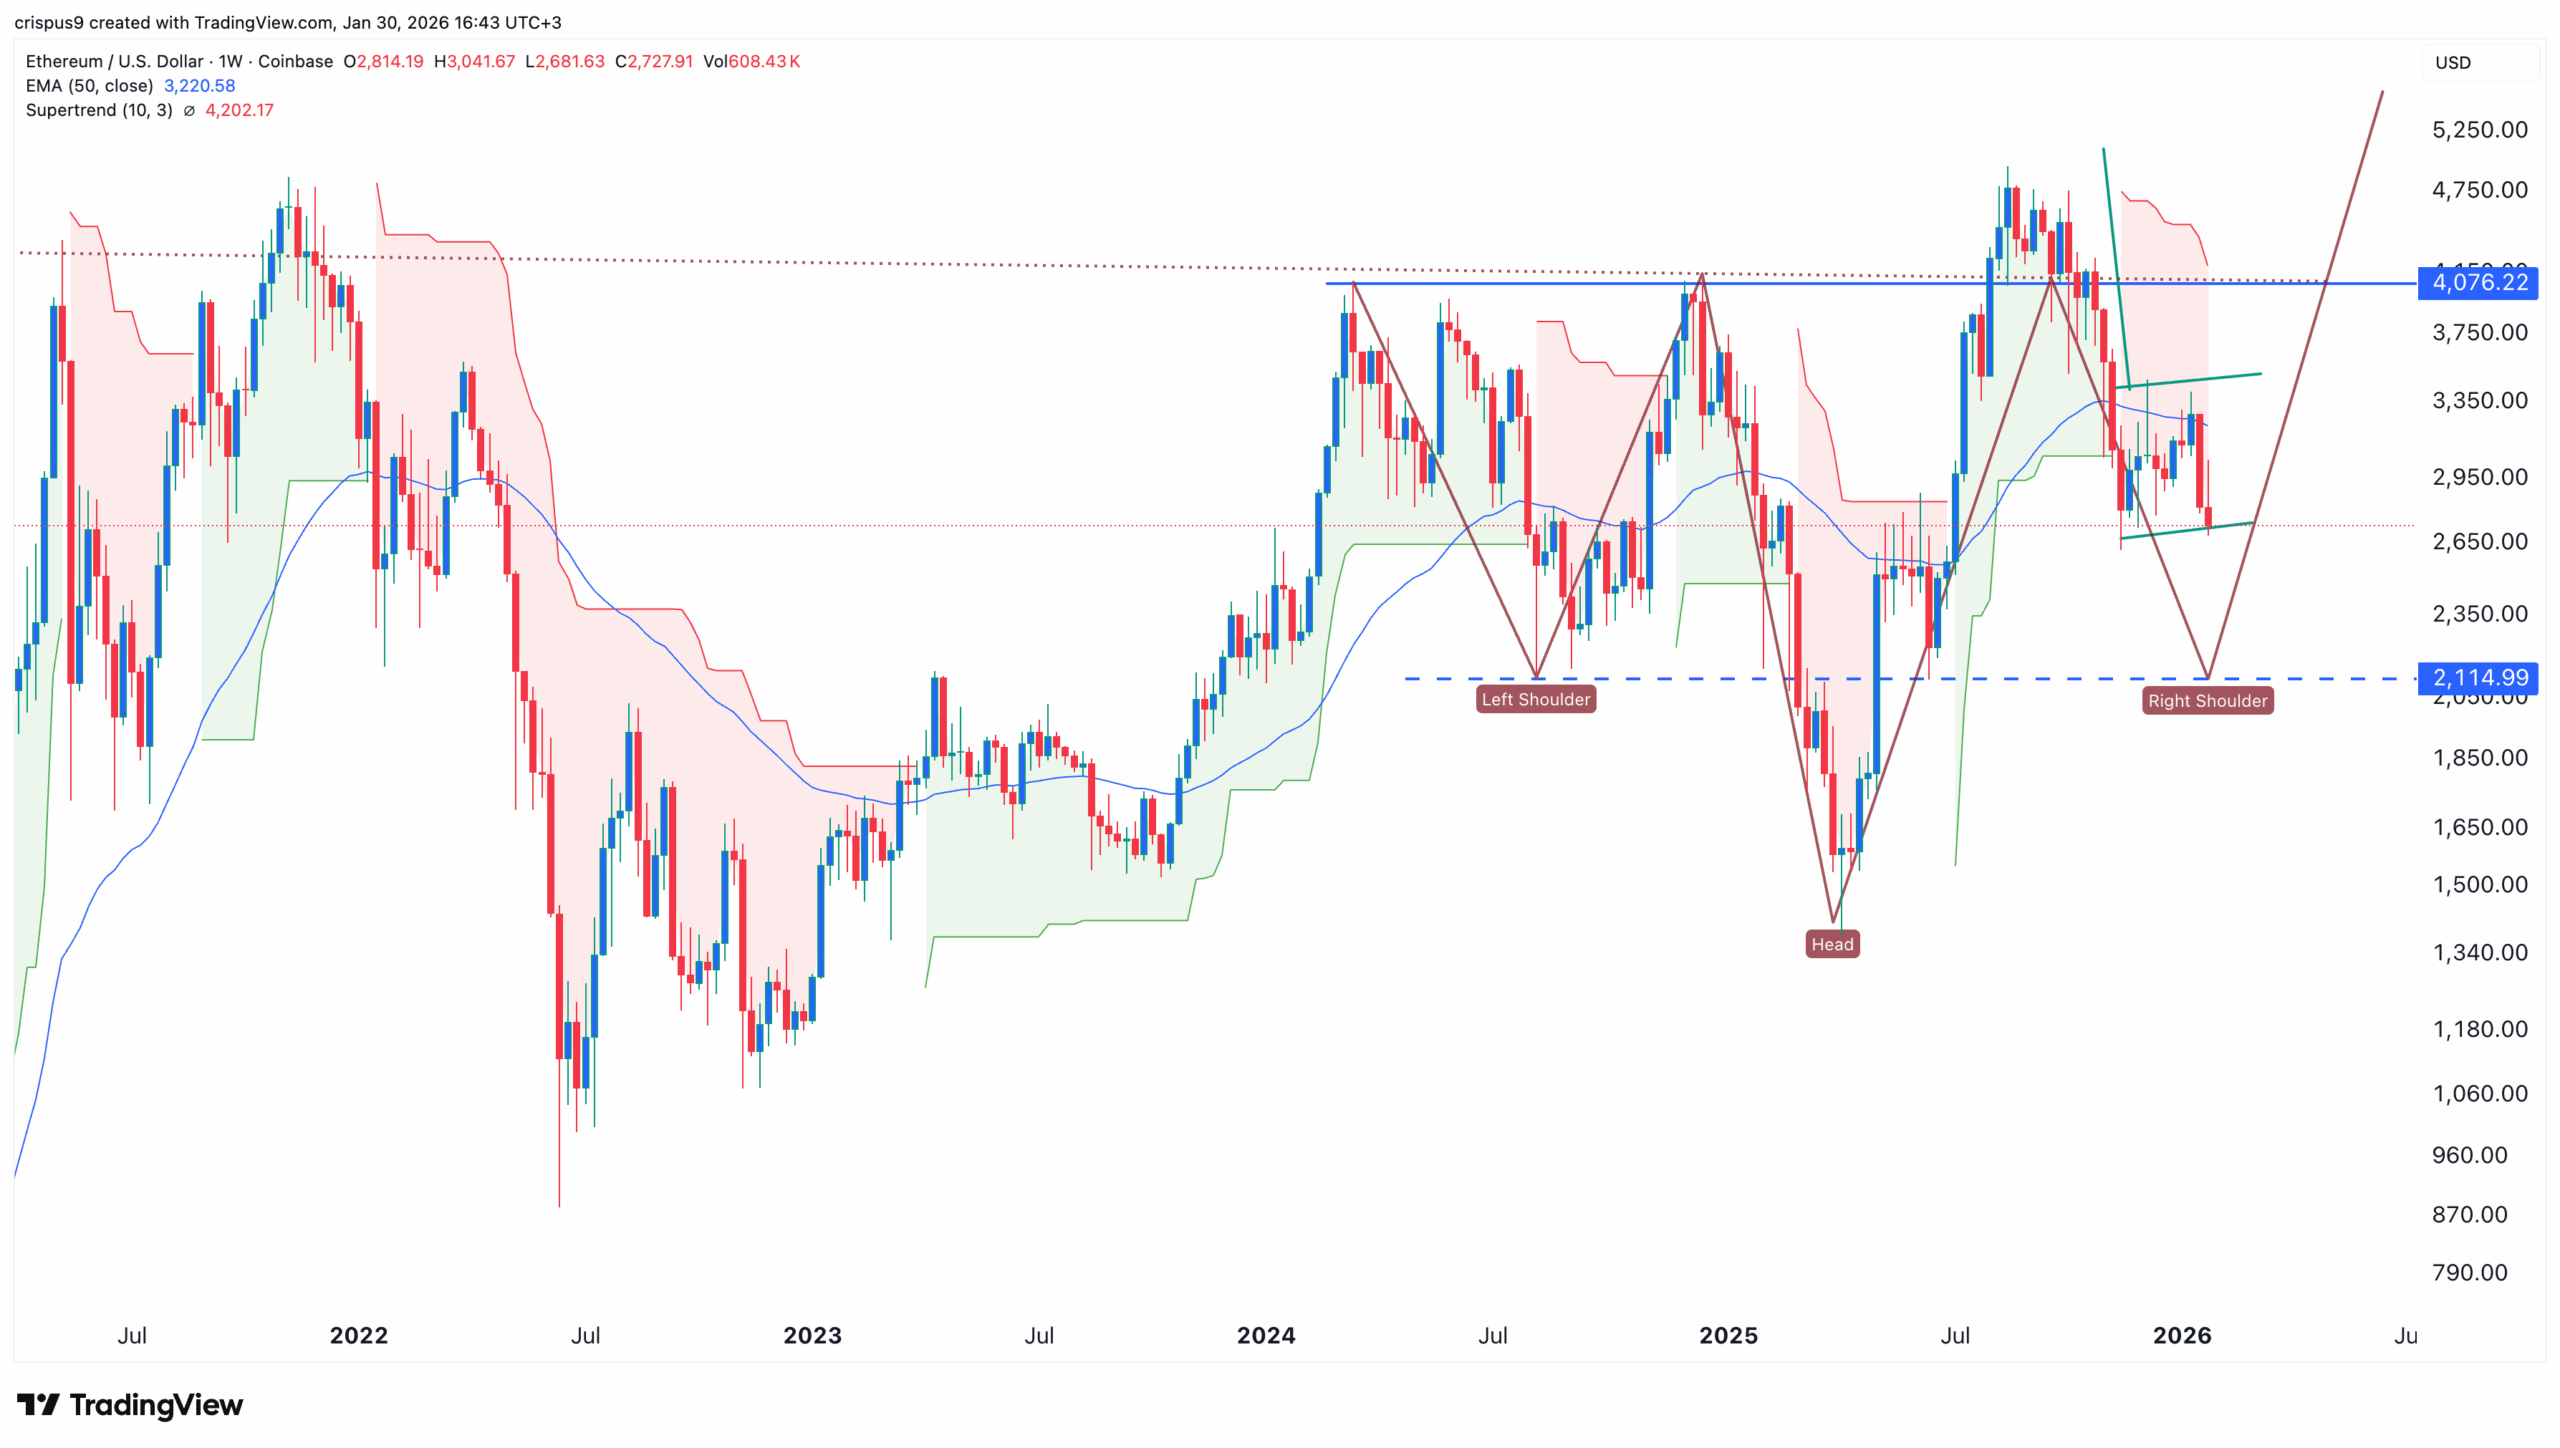
Analysts also highlight an inverted head-and-shoulders structure that could send ETH toward the $2,114 support level. A break below that zone may open the door to a move toward the $2,000 psychological level. Traders will watch macro trends, ETF flows, and on-chain activity to gauge whether Ethereum can stabilize or continue its downward trajectory.
#blockchain #crypto, #decentralized, #distributed, #ledger

